
Chainlink has continued to struggle below the critical $10 level as uncertainty dominates the broader crypto market, with traders waiting for a decisive move to break the current consolidation structure. Despite repeated recovery attempts throughout May, LINK has failed to establish sustained bullish momentum, leaving the asset trapped beneath key resistance while market participation remains relatively subdued.
However, a CryptoQuant analysis tracking Binance exchange flows suggests that the underlying market structure may be shifting in a way that price action alone is not yet reflecting.
According to the analysis, Binance netflows have remained deeply negative throughout May, with continuous outflows dominating exchange activity. The persistent red bars across the charts indicate that large holders are aggressively withdrawing LINK from Binance and moving tokens into self-custody wallets rather than preparing them for sale on the open market. This behavior is typically associated with long-term positioning and institutional-style accumulation rather than short-term speculative trading activity.

The implications for supply dynamics are significant. As LINK continues leaving exchanges in large quantities, the amount of immediately available sell-side liquidity on Binance order books gradually declines. The analysis notes that this type of prolonged exchange depletion historically creates conditions for a potential supply shock, where even moderate buying pressure can produce disproportionately strong price movements because fewer tokens remain available for sellers to distribute into demand.
AWS CCIP and a Support Level That Refuses to Break
The CryptoQuant analyst identifies the support defense around May 22 as structurally significant rather than coincidental. When outflow spikes create temporary selling pressure — coins moving off exchanges in volume while the price tests support — the market’s ability to absorb that pressure without breaking lower confirms that genuine demand exists at the current level.
The buyers defending this zone are not simply catching a falling asset. They are absorbing supply at a price they have repeatedly chosen to defend.
The fundamental backdrop adds the dimension that separates the current accumulation pattern from purely technical behavior. Chainlink’s integration into the AWS Marketplace, effective May 25, 2026, materially lowers the barrier for institutional participants to access and implement CCIP — Chainlink’s cross-chain interoperability protocol.
As CCIP establishes itself as the infrastructure standard for connecting blockchain networks, the demand for LINK begins decoupling from the Bitcoin-beta correlation that has historically defined its price movements. Utility-driven demand and speculative demand behave differently — and the exchange flow data suggests the former is increasingly present.
The forward condition the analysis identifies is precise. As long as outflows continue outpacing inflows on Binance, the accumulation phase remains structurally intact. Sideways consolidation at a defended support zone — with exchange liquidity gradually exhausting — has historically preceded sharp breakouts rather than breakdowns. The supply is leaving. The buyers are holding. The AWS catalyst has arrived. The setup is assembling quietly while the price waits for the final piece.
Chainlink Consolidates Below Major Resistance
Chainlink continues trading below the psychological $10 level after months of sustained selling pressure, but the weekly chart suggests the asset may be attempting to build a long-term base near a historically important support region. LINK is currently consolidating around $9.60 after recovering from the sharp breakdown that pushed price briefly below the $8 mark earlier this year.
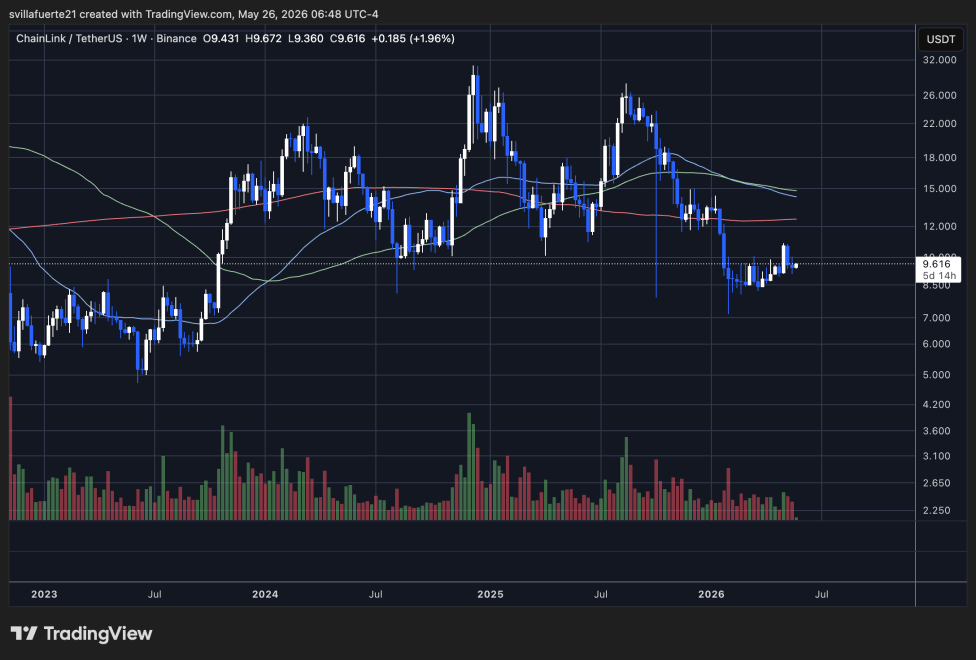
Technically, the chart shows Chainlink trapped beneath the 50-week, 100-week, and 200-week moving averages, all of which continue acting as dynamic resistance overhead. The rejection from the $25 region in late 2025 initiated a strong bearish trend that erased much of the previous rally and forced LINK back toward levels last seen before the major breakout phase of 2023.
However, the current structure differs from earlier periods of weakness because volatility has begun compressing significantly near support. Since March, sellers have repeatedly failed to push LINK decisively below the $8–$9 region despite broader market uncertainty. That behavior suggests buyers continue absorbing supply near these levels, reinforcing the accumulation narrative reflected in Binance outflow data.
Volume has also declined during the consolidation phase, a condition often associated with exhaustion in directional momentum. If LINK eventually reclaims the $12 region and breaks above the cluster of weekly moving averages, the current sideways structure could transform into the foundation for a larger recovery phase driven by tightening exchange supply conditions.
Featured image from ChatGPT, chart from TradingView.com

You can get bonuses upto $100 FREE BONUS when you:
💰 Install these recommended apps:
💲 SocialGood - 100% Crypto Back on Everyday Shopping
💲 xPortal - The DeFi For The Next Billion
💲 CryptoTab Browser - Lightweight, fast, and ready to mine!
💰 Register on these recommended exchanges:
🟡 Binance🟡 Bitfinex🟡 Bitmart🟡 Bittrex🟡 Bitget
🟡 CoinEx🟡 Crypto.com🟡 Gate.io🟡 Huobi🟡 Kucoin.
















Comments